
Visualising Data
This activity is designed to help demonstrate the value of sketching in a UX Design context. A sketch is a quickly produced drawing that make ideas or abstract data visible. Because ideas can be fleeting or transient the important thing is to capture them before they disappear or are forgotten.
For most people the best way to sketch is to make marks on paper with a pen or pencil. For this activity use whatever works most quickly for you.
It is not important that sketches are done neatly. If they have merit, they can be developed into slick graphics and design templates later-on. There are two parts to this activity. Allow at least 30 minutes for each step.
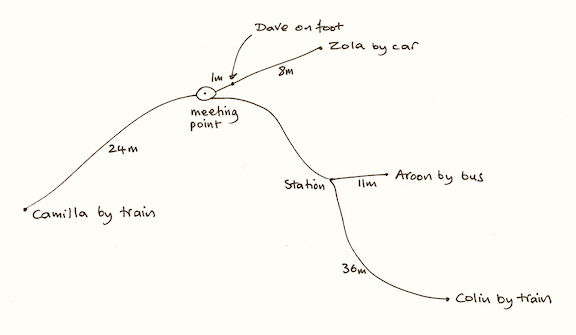
A quick sketch (above) visualising the five journeys suggested by this activity. Easily produced in about ten minutes with much use of a pencil eraser.
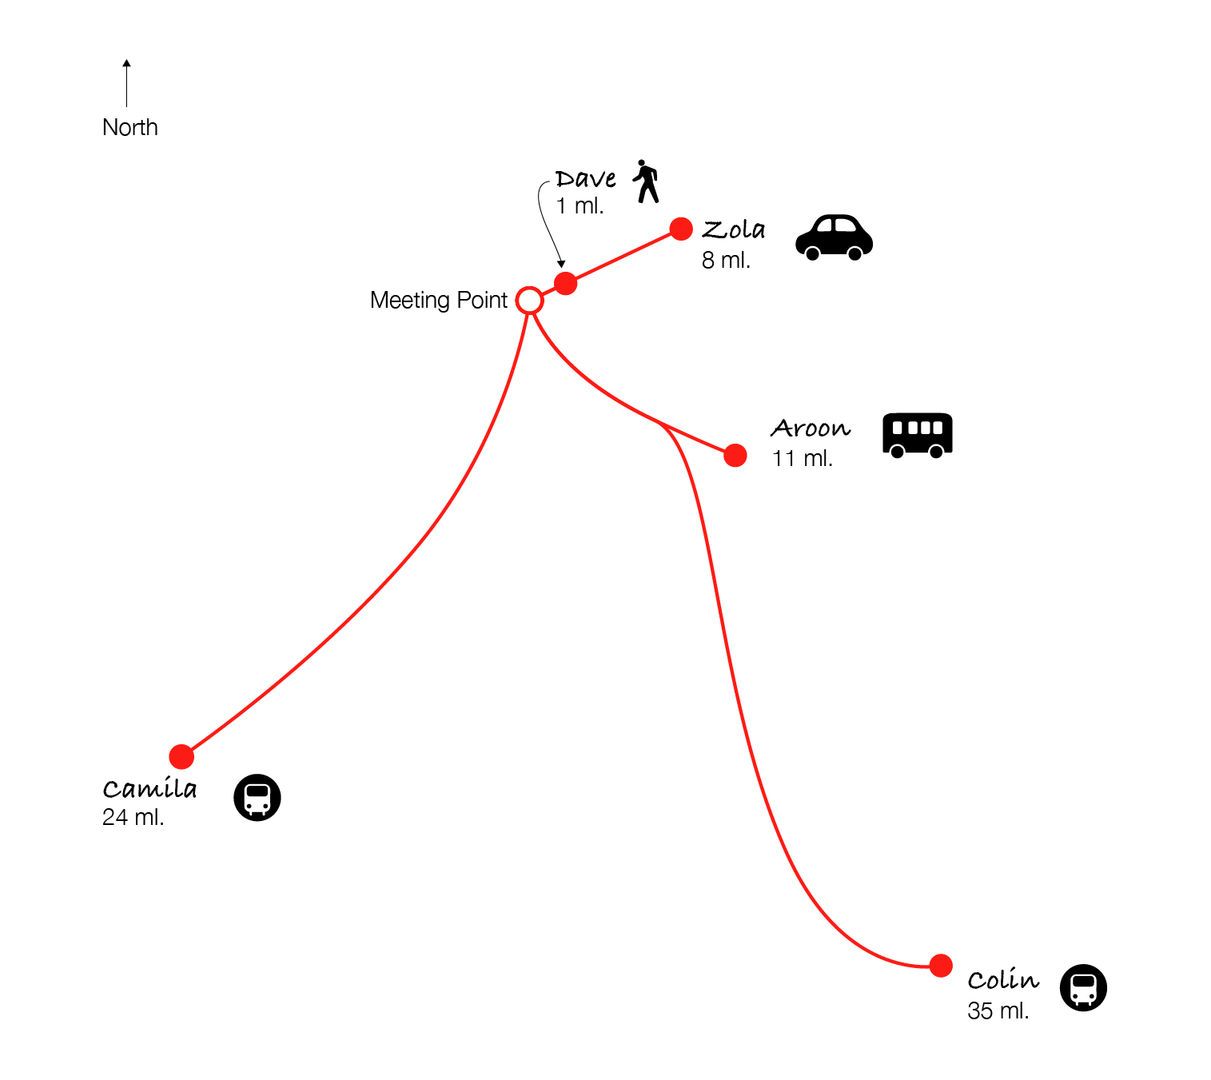
The digital version (below) took a little longer and was produced because it can be edited for the different language editions of the book. If you think that the sketch is too simple to be useful then consider how much writing would be needed to communicate the same information. How easy would it be to remember?
Steps
The data
Let’s imagine that 5 friends are starting a journey to meet you at your current location. You know where they all are at the moment:- Dave is at your favourite local coffee shop
- Aroon is at the nearest large grocery store
- Camila is at the nearest passenger sea port
- Colin is at the nearest international airport
- Zola is at the nearest emergency hospital
Hopefully you have an idea of the approximate distance and direction of all of these places relative to your own location. If not, then ask someone with local knowledge for help. As a last resort guess! On the largest piece of paper you can find, sketch a map with your current location at the centre.
Try to sketch in such a way as to show a range of multidimensional information, for example:
The location and distance of each friend as they start their journey towards your location and the form of transportation they may take.
Award yourself a point for each piece of information that can be derived from the sketch, for example; Where friends may cross paths and the combined travelling distance of all your friends.
If you are doing this activity with others, then perhaps compete to see who can achieve the most points.
Imagining
Let’s stretch our imagination further to the day when an artificial intelligence powered application can accurately calculate the best time for each of your friends to depart, summon an autonomous vehicle and deliver them to your location. In the previous step you have already begun to think about the human and logistical factors of the situation.The act of creating the sketch has hopefully worked as a catalyst and visualised the scenario. Now, while the factors are fresh in your mind think about the design of the app. How will it work to reduce the burden of planning individual journeys? How could it improve the experience of its users? Perhaps it could proactively design routes where friends travel together or accommodate last minute changes of venue for the meeting?
Make some quick sketches of your ideas. These could include; simple interface designs that show the flow or a map of the interaction architecture or just a sequence of interface states. However, you choose to do it, remember that as well as sketching ideas on paper to externalise your own thoughts, you are also developing a process to communicate your ideas to others.