
Visuals
Introduction
Over 140 visuals are included in the second edition
Skills and Roles
A table correlating UX Design roles and skillsets
Methods and Roles
A table correlating project stages, people and job titles
Stakeholder Grid
A visual aid to understanding stakeholder involvement in a project
PANAS Questionnaire
A paper based form for acquiring and scoring responses in a PANAS study
A UX Process Model
A model UX Design process diagram
Scenario map
An example of user story analysis using a simple scenario map
A Design Cycle
A standard non-linear and iterative design cycle diagram
Scenario map
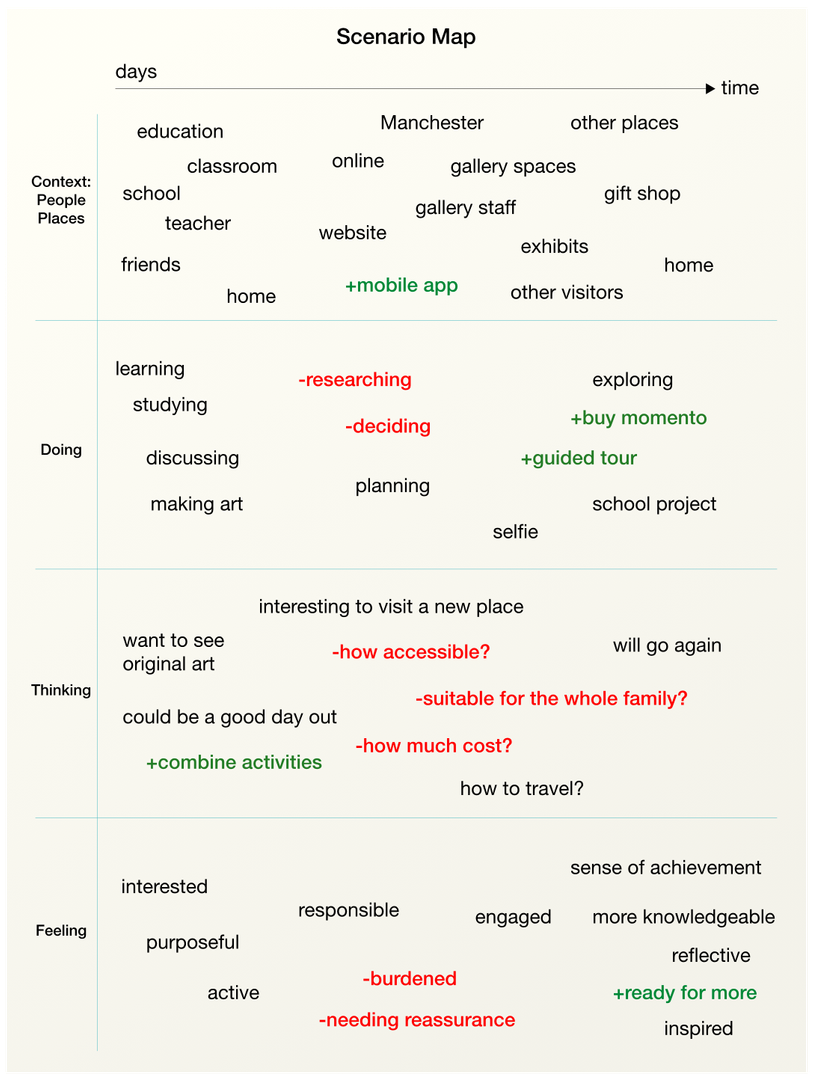
Figure 48
A scenario map for George’s story (see below). Words in red are seen as potential pain points in the user experience. Green words highlight ideas that could be developed further. See page 77 and Activity #7 in the second edition.
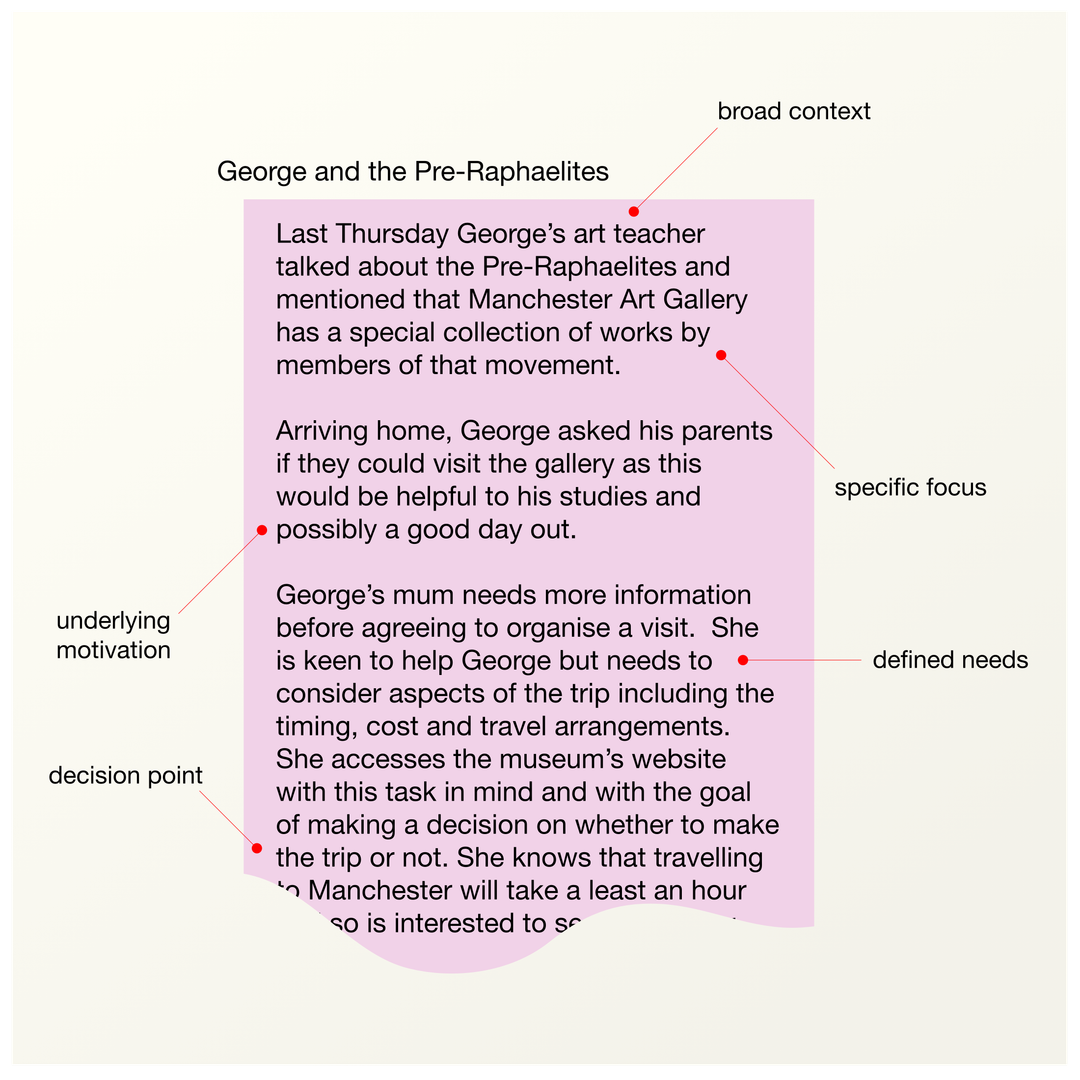
Figure 46
George’s art gallery scenario can be dissected to reveal important aspects of the story as they relate to George’s potential experience.