
Visuals
Introduction
Over 140 visuals are included in the second edition
Skills and Roles
A table correlating UX Design roles and skillsets
Methods and Roles
A table correlating project stages, people and job titles
Stakeholder Grid
A visual aid to understanding stakeholder involvement in a project
PANAS Questionnaire
A paper based form for acquiring and scoring responses in a PANAS study
A UX Process Model
A model UX Design process diagram
Scenario map
An example of user story analysis using a simple scenario map
A Design Cycle
A standard non-linear and iterative design cycle diagram
PANAS Questionnaire
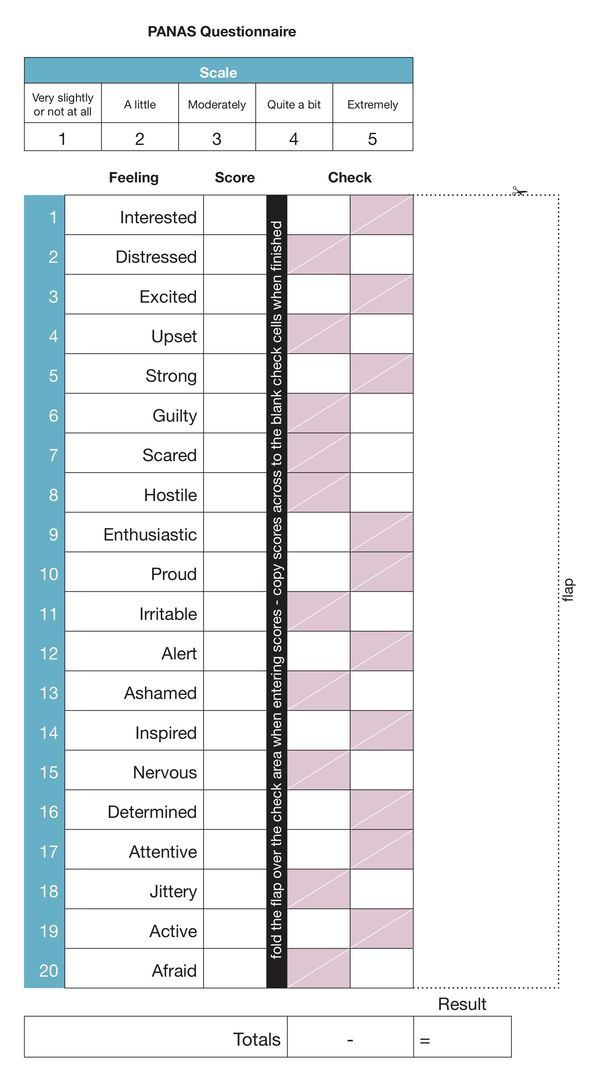
Figure 26
This form is used to capture responses in a Positive and Negative Affect Schedule (PANAS). The process for this is covered in Activity #5. Download PDF
Reference
Watson, D., Clark, L. A., & Tellegan, A. (1988). Development and validation of brief measures of positive and negative affect: The PANAS scales. Journal of Personality and Social Psychology, 54(6), 1063–1070.