
Visuals
Introduction
Over 140 visuals are included in the second edition
Skills and Roles
A table correlating UX Design roles and skillsets
Methods and Roles
A table correlating project stages, people and job titles
Stakeholder Grid
A visual aid to understanding stakeholder involvement in a project
PANAS Questionnaire
A paper based form for acquiring and scoring responses in a PANAS study
A UX Process Model
A model UX Design process diagram
Scenario map
An example of user story analysis using a simple scenario map
A Design Cycle
A standard non-linear and iterative design cycle diagram
Methods and Roles
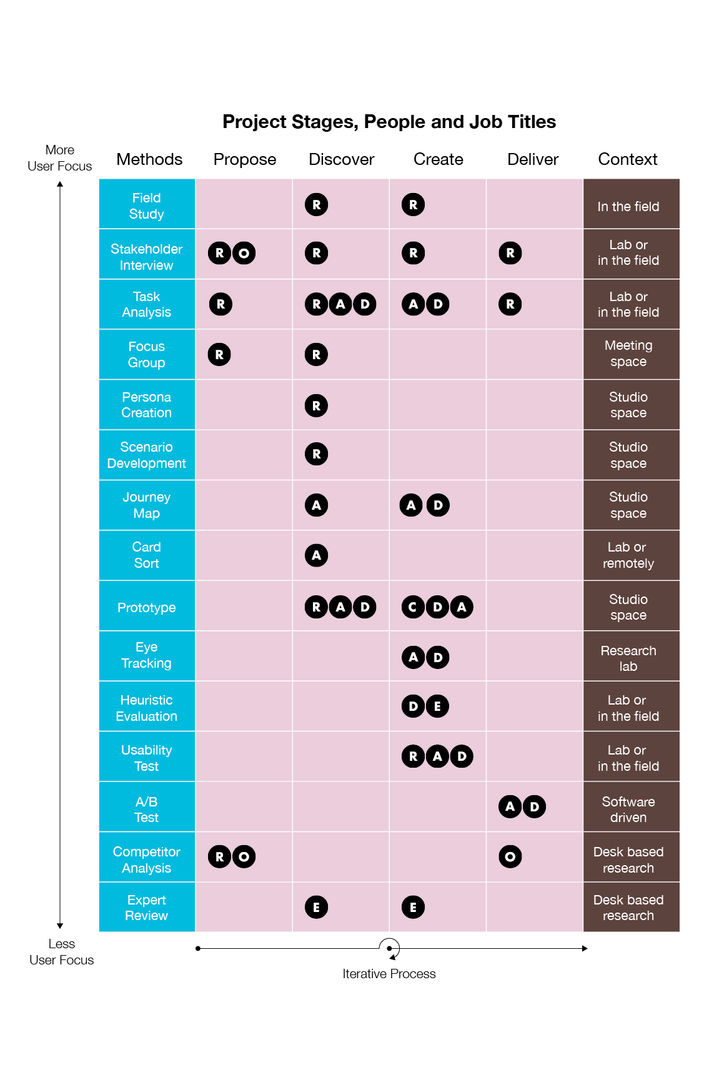
Figure 10
A table of 15 common methods used by teams taking a UX Design approach. The methods are ranked by their focus on user experience, when in a typical project they are likely to be applied and who may be expected to apply them.