
Visuals
Introduction
Over 140 visuals are included in the second edition
Skills and Roles
A table correlating UX Design roles and skillsets
Methods and Roles
A table correlating project stages, people and job titles
Stakeholder Grid
A visual aid to understanding stakeholder involvement in a project
PANAS Questionnaire
A paper based form for acquiring and scoring responses in a PANAS study
A UX Process Model
A model UX Design process diagram
Scenario map
An example of user story analysis using a simple scenario map
A Design Cycle
A standard non-linear and iterative design cycle diagram
A Design Cycle
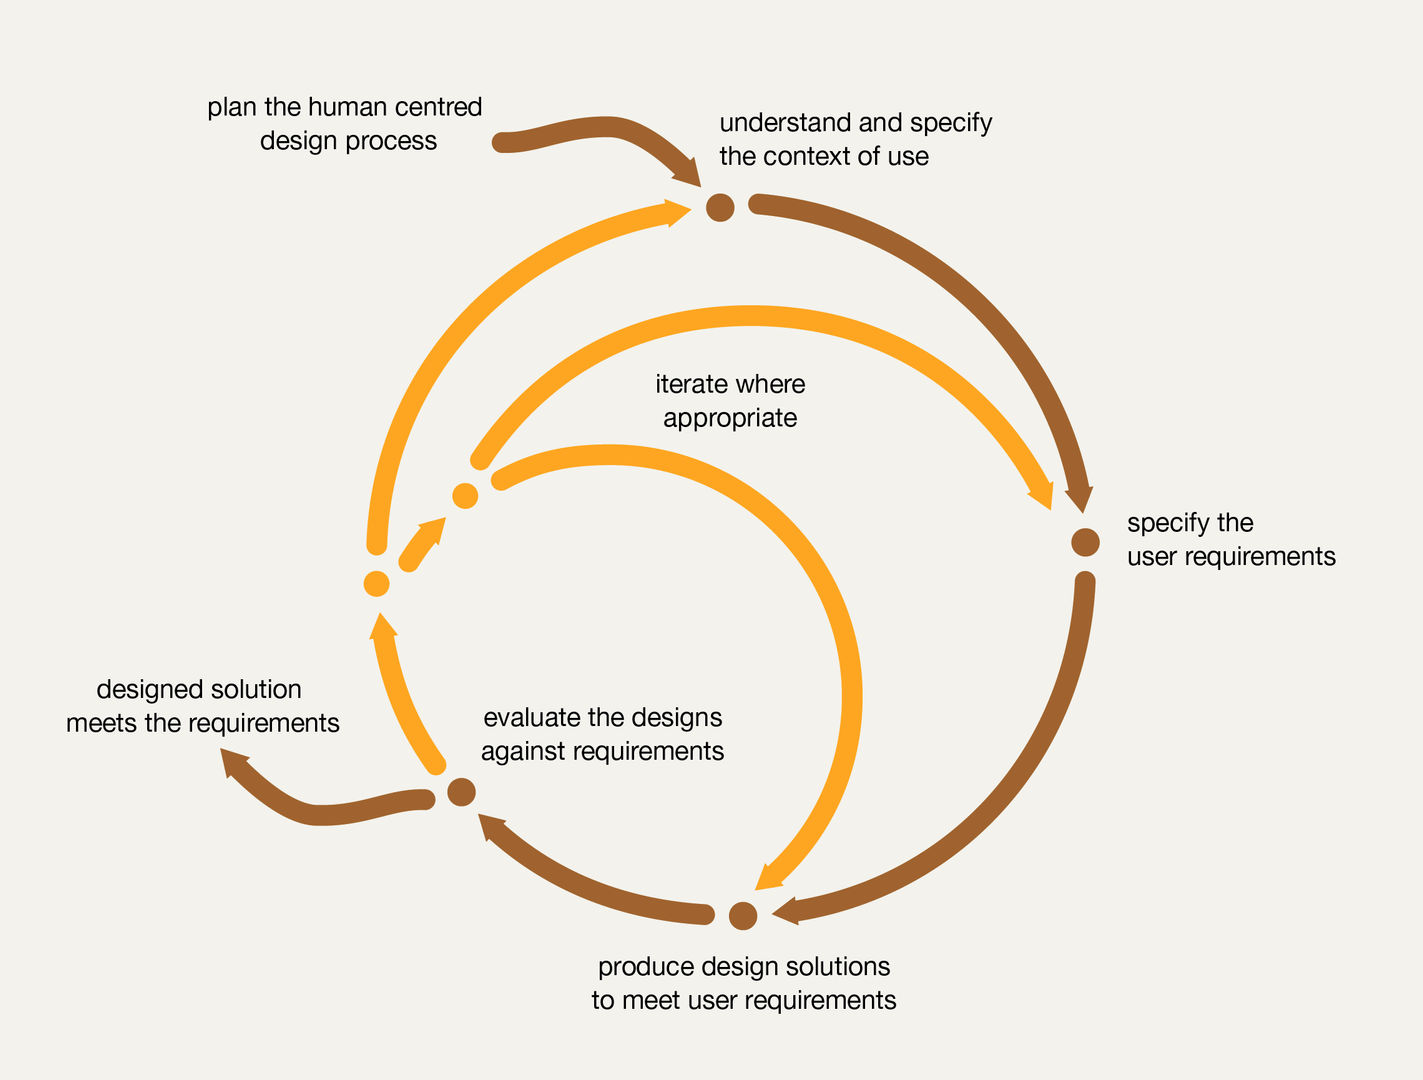
Figure 52
This diagram is adapted from one within Ergonomics of human-system interaction - Part 210: Human-centred design for interactive systems BS EN ISO 9241-210. It shows that user-centred design does not follow a strict linear process and illustrates that each human-centred design activity uses outputs from other activities. Design activities continue in an iterative cycle until the solution meets the requirements.