
Visuals
Introduction
Over 140 visuals are included in the second edition
Skills and Roles
A table correlating UX Design roles and skillsets
Methods and Roles
A table correlating project stages, people and job titles
Stakeholder Grid
A visual aid to understanding stakeholder involvement in a project
PANAS Questionnaire
A paper based form for acquiring and scoring responses in a PANAS study
A UX Process Model
A model UX Design process diagram
Scenario map
An example of user story analysis using a simple scenario map
A Design Cycle
A standard non-linear and iterative design cycle diagram
Stakeholder Grid
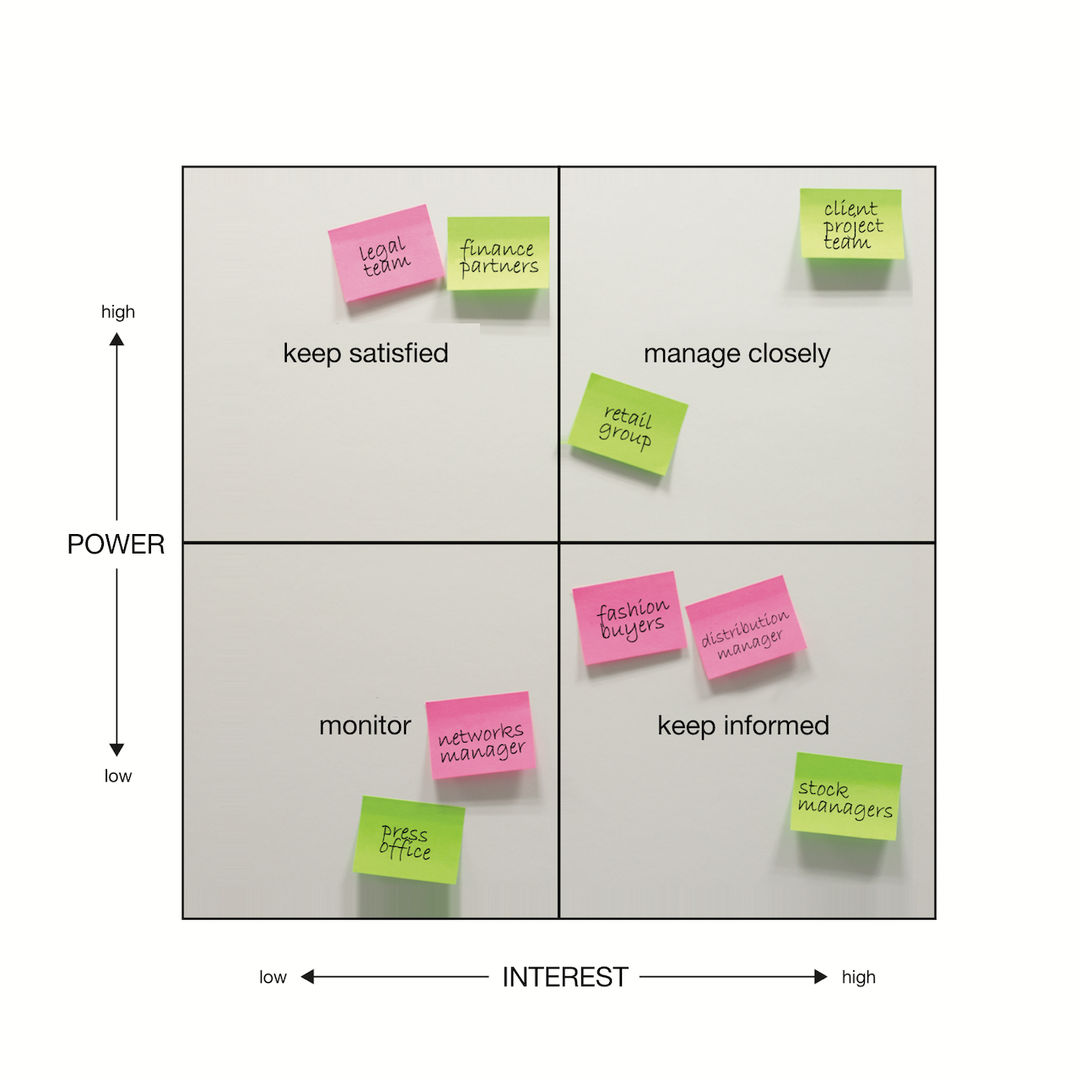
Figure 11
A grid representing stakeholders in a project to deliver an online store for a fashion retailer. Easy to update, this simple device can help to keep the project team mindful of the power/interest of different stakeholders.